
MTG Retail Analytics & Inventory Optimization
Executive Summary
In this side project, I helped an MTG specialty store improve its Q3 profitability by 12% by identifying underperforming SKUs and recommending data-driven stocking strategies. Using SQL and Power BI, I integrated point-of-sale, eCommerce, and inventory data into a single dashboard to support clear restocking decisions. This project demonstrates my ability to translate fragmented data into actionable insights with measurable business outcomes.
Full business context, metrics, visualizations, and SQL logic in Appendix
Business Context
The client, an Oxford-based MTG store with physical and online sales, struggled with slow inventory turnover and cash flow issues. Decisions were made based on experience rather than performance data, and there was no consistent SKU tracking across channels.
Key Insights
- Identified channel-based purchasing behavior: Modern format products performed best in-store, while Commander (EDH) products sold online
- Found that Core Sets consistently underperformed, turning less than 1 unit per week
- Discovered SKU inconsistencies that fragmented tracking and created reporting blind spots
Solution & Execution
- Standardized SKU schema and merged 2,000+ rows of cross-channel sales data using SQL
- Designed Power BI dashboards highlighting sell-through rates and inventory alerts
- Defined KPIs (e.g., 30% sell-through in 60 days) based on research and stakeholder interviews
- Delivered stocking recommendations and product bundling strategies to store owner
Business Impact
- Increased Q3 profit by 12% through product realignment
- Cleared ~$2,500 in stagnant inventory
- Improved ordering strategy and implemented a sustainable inventory tracking SOP
Dashboard Snapshot
Dashboard included:
- Sell-through rates by product & channel
- Inventory performance alerts
- Top vs low-performing SKUs by release set
Learn More
Execution Breakdown
Data Workflow
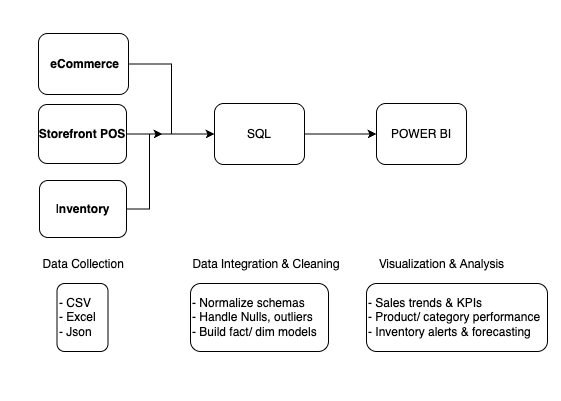 Illustrates the full pipeline from raw POS and online sales data to unified dashboards in Power BI.
Appendix
Technical Summary
- Tools: SQL, Excel, Power BI
- Joined and cleaned multi-format datasets (CSV, Excel)
- Created SKU naming standard:
[Set]-[Item]-[Language] - Wrote SOP for long-term product import & analysis
Additional Materials
- Download Full Report (PDF)
- SQL Snippets & Forecasting Prototype
- KPI Definitions and Benchmarks
- Stakeholder Notes & Q3 Planning Outcomes
Portfolio Framework & Deep Dive Map
| Section | Purpose | Link to Detail |
|---|---|---|
| Problem Statement | What we were solving and why it mattered | Business Context |
| Commercial Understanding | How I validated KPIs and business logic with real-world players and owners | Metrics & Benchmarking |
| Data Operations | How I cleaned and standardized cross-channel data | Data Sources & Setup |
| Visualization | Dashboard and KPI layout to guide decisions | Key Insights & Visualization |
| Forecasting (Advanced) | Used release cycles and trends to explore basic sales prediction | Future Enhancements |
| Stakeholder Engagement | How insights were translated into actions adopted by the store | Reflection & Learnings |
Discovery Through the Work
By diving into actual data and store behavior, I uncovered:
- Key differences in customer behavior across channels (Modern players in-store, EDH online)
- Core sets underperformed everywhere, while Modern sets had strong regional demand
- SKU naming inconsistency caused fragmented tracking and frequent errors
These were not originally known — they emerged as the data became structured.
Collaborating for Business Logic
I visited multiple MTG retailers and interviewed staff and owners. This helped me:
- Validate that slow-moving was typically <1 unit/week in specialty retail
- Confirm that sell-through should exceed 30% within 60 days for liquidity
- Understand product bundling practices and their impact on shelf rotation
These insights informed our KPI definitions and stocking strategy.
Technical Execution: Data Engineering & Analytics
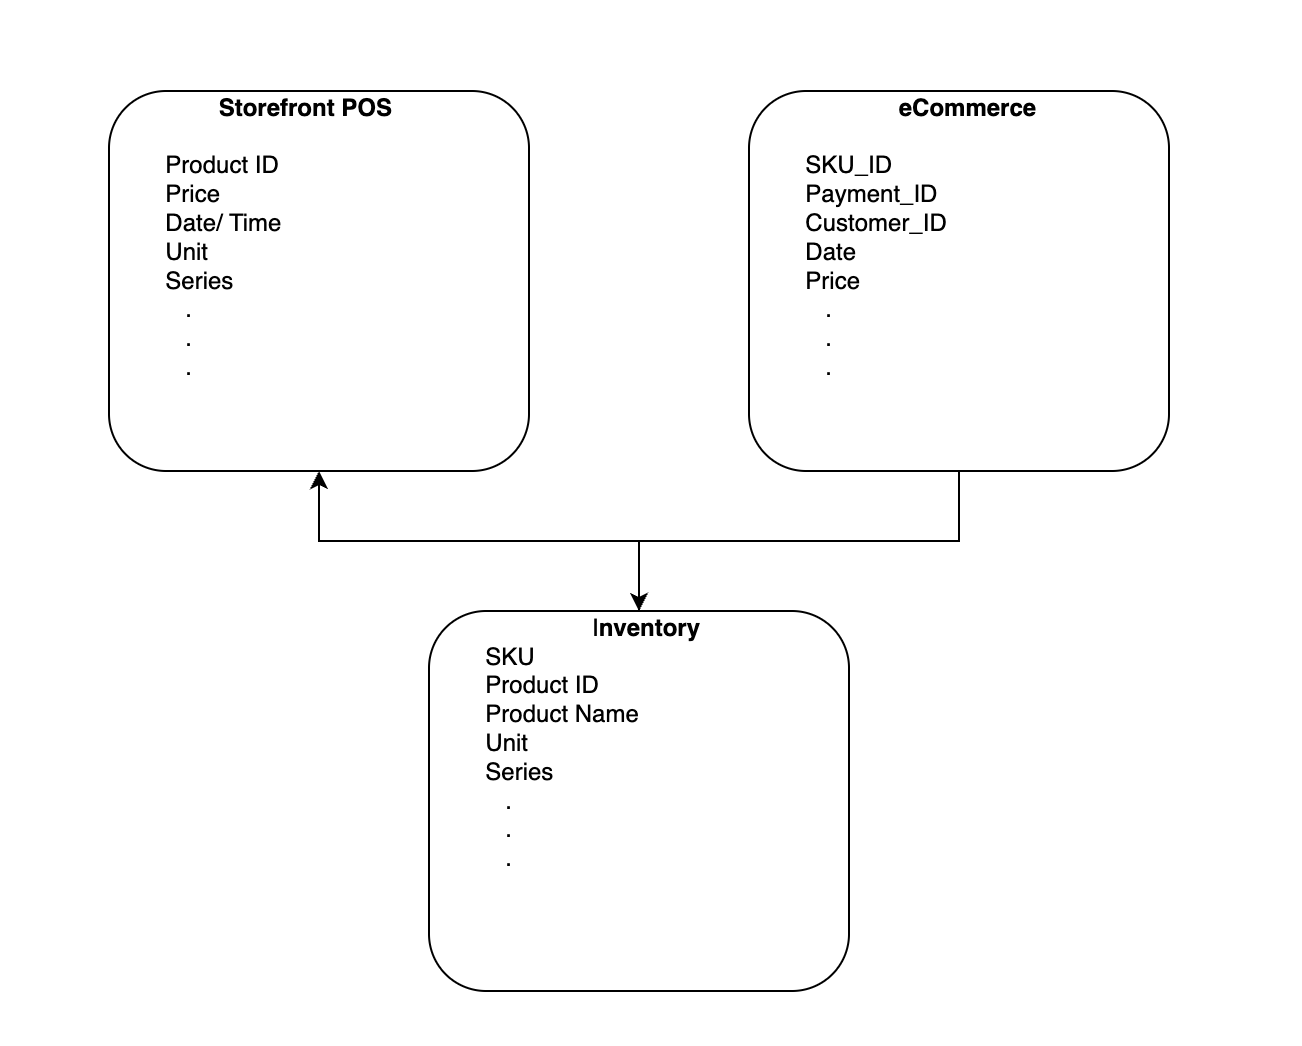
Data Source
Data Cleaning
- Removed duplicates from web orders
- Merged inventory records across channels
- Standardized SKUs with
[Series]-[Product]-[Language]format
Data Management
- Created SKU map for long-term consistency
- Designed lightweight SOP for future imports
Visual Analytics
- Built Power BI dashboard tracking:
- Sell-through rate
- Top SKU performance
- Stock turnover by channel
Future Enhancements
Predictive Time Series
- Identified release cycles for MTG sets (every 12 weeks)
- Began prototyping a basic time series forecast model to pre-allocate stock by format (Commander, Modern)
Appendix will contain forecasting visual and seasonal SKU heatmap
Check the full report HERE Download Full Report (PDF)
- [Business Data Model] POS + Web + Inventory → SQL → Power BI
This pipeline demonstrates how I integrated multi-source retail data using SQL and visualized insights using Power BI:
-
Data Collection
Sources include POS transactions, web orders, and inventory logs across multiple formats (CSV, Excel, APIs). -
Data Integration & Cleaning
Standardized schemas, handled missing/outlier values, and created unified sales models via SQL. -
Data Visualization & Business Impact
Built Power BI dashboards that revealed key sales trends, inventory alerts, and product performance metrics.
-
[SKU Table] Before/after transformation examples
-
[Segmentation Logic] Player type vs format mapping
-
[KPI Definitions] Thresholds and benchmarks from field research
-
[Dashboards] Power BI screenshots with filters and cards
-
[SQL Snippets] Join/clean logic + sell-through calculation
-
[Impact Charts] Revenue, SKU shift, stock efficiency
-
[Forecasting Sandbox] Early prototype of time-based SKU demand by set
-
[Stakeholder Notes] How insights were presented and used in Q3 planning